
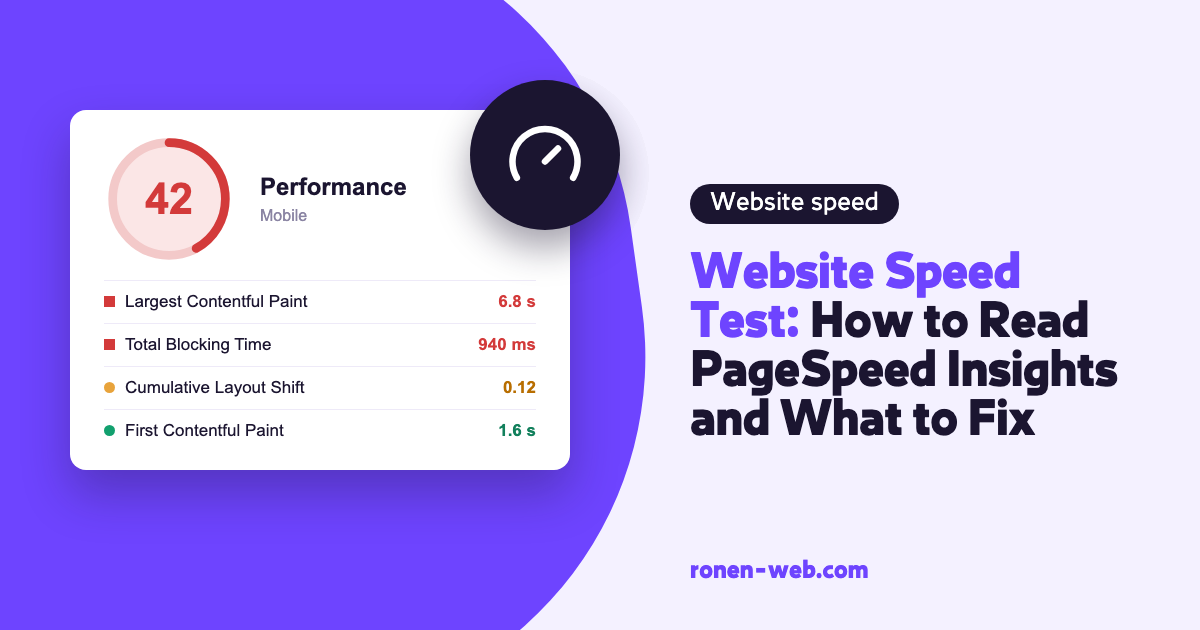
A reliable website speed test starts with Google’s PageSpeed Insights, and with one thing most people miss: the report contains two kinds of data. The top part shows field data, meaning how real users experienced the page. The bottom part shows lab data, a single test in a simulated environment. The colorful score everyone looks at belongs to the lab part.
So before you panic over a red score, check what your users actually experience. Then go through the metrics one by one, understand what is stuck and fix it. At the end, measure again, with the same tool and on the same page, to know whether the fix worked.
In this article I put together a working order for reading the report: what each metric means, how to find the problem behind it and how to fix it on a WordPress site.
Step 1: Run a Google website speed test in PageSpeed Insights the right way
Go to PageSpeed Insights, paste the URL of a specific page and run it. There is a separate result for mobile and desktop, and it is worth starting with mobile, because the conditions there are tougher. And while you are testing on mobile, check that the page is displayed correctly there and not just fast, which I covered in the guide on responsive websites.
According to the PageSpeed Insights documentation, field data comes from the Chrome User Experience Report (CrUX), and it summarizes the experiences of real users over the last 28 days. Lab data comes from Lighthouse, which tests the page in a simulated environment: on mobile, a mid-range device on a cellular network, and on desktop, a computer with a wired connection.
In practice this means field data will not move tomorrow morning after you fix something, because it is a rolling average of four weeks. Lab data will move right away, so that is where you check whether a fix did anything.
- Field data: what happened to your visitors. This is what matters.
- Lab data: one run under fixed conditions, used for diagnosis and for before and after comparison.
The web.dev documentation says it explicitly: when there is a gap, prioritize field data, and use lab data to find what to improve.
Step 2: Pass or fail on Core Web Vitals
At the top of the report you will see whether the page passes the Core Web Vitals assessment. There are three metrics, and each one measures something different:
| Metric | What it measures | Good | Poor |
|---|---|---|---|
| LCP | How long until the largest content on the screen appears | Up to 2.5 seconds | Over 4 seconds |
| INP | How quickly the page responds to a click or keypress | Up to 200 milliseconds | Over 500 milliseconds |
| CLS | How much the content jumps around during loading | Up to 0.1 | Over 0.25 |
According to the definition on web.dev, the values are measured at the 75th percentile. In plain words, for a page to count as good, at least three quarters of visits must meet the target, separately on mobile and desktop.
Sometimes the report says there is not enough data. This happens on sites with little traffic. Google explains that when there is not enough data for the specific URL, the tool falls back to data for the whole site (origin), and if that does not exist either, you are left with lab data only. It does not mean the site is broken, only that there are not enough visits from Chrome users to build a picture.
Step 3: Slow LCP, the main content appears late
This is where LCP shows up in orange or red. The largest element can be the top banner image, a main image or a large block of text. In the diagnostics section, Lighthouse shows which element was chosen as the LCP, so you know exactly what to work on.
web.dev breaks LCP into four parts: time to first byte from the server (TTFB), the delay until the browser starts downloading the image, the download time itself, and the delay until the element is rendered.
Each part has its own cause and fix:
- Slow server: in WordPress, according to the official documentation, page caching is the step that gives the most return. A caching plugin stores pages as static files, and the server does not rebuild them on every visit. Not every plugin suits every site, and in the guide on speed optimization plugins there is a comparison of the common options.
- The main image is lazy loaded: if the top image has
loading="lazy", the browser holds it back. web.dev recommends not applying lazy loading to the LCP element, and giving itfetchpriority="high". - A heavy image: compression and a modern format help here. The WordPress documentation recommends WebP when possible.
- CSS and JavaScript that block rendering: scripts that are not needed for the top of the page can be deferred.
Step 4: High CLS, the page jumps
You feel this even without tools: you start reading and suddenly the text drops down, or you go to click a button and it moves right then. In Lighthouse you will see which elements caused the shift.
According to web.dev, these are the common causes and their fixes:
- Images without dimensions: add
widthandheightto the image tag, oraspect-ratioin CSS, so the browser reserves space ahead of time. - Banners, ads and embeds that load late: reserve space for them with
min-height. - Content injected above existing content: for example a notice bar or a cookie banner that pushes the page down.
- Fonts: swapping between a fallback font and the site font can move text. You can preload the critical font and pick a fallback font that is close in size.
- Animations: animate with
transformand not withtoporleft.
Step 5: High INP, the site responds slowly to clicks
INP appears only in field data, because it depends on real user interaction. In practice it looks like a mobile menu that opens late, or an add to cart button that does not respond right away.
According to web.dev, the main cause is long tasks that block the browser’s main thread. In WordPress this is usually too much JavaScript from plugins, page builders and external scripts such as chat widgets and pixels. What you can do:
- Go through the plugin list and remove what you do not use. This is also the first step on the WordPress optimization list.
- Defer third-party scripts until after the first interaction.
- Reduce the number of elements on the page (a large DOM), for example on pages built in layers on top of layers.
Step 6: The performance score, and what it does not tell you
The score from 0 to 100 is a lab score. According to Google, 90 and above is good, 50 to 89 needs improvement, and below 50 is poor.
But Google does not use this score for ranking. In Google’s document on page experience, Google writes that there is no single page experience signal, and that good results in the Core Web Vitals report or in other tools do not guarantee your page will appear at the top of the results. It also writes that it always tries to show the most relevant content, even if the page experience is not perfect.
So the goal is not 100, but for all three metrics to be green for real users. If the page passes Core Web Vitals in field data and the lab score is 75, it is not worth burning a week on a few more points. And if you want to see where speed fits into the bigger picture, I wrote about it in the article on how to improve your Google ranking fast.
Step 7: Measure before and after
A website speed test is only worth something if it has a point of comparison. This is the order:
- Before you touch anything, run PageSpeed Insights on the same pages (home page, a service page, a product page) and save a screenshot of the field data and the lab data.
- Change one thing at a time. If you turned on five settings together and the site broke, you will not know what broke it.
- Clear the cache of the plugin and of the CDN, and run it again. The lab data will change right away. It is worth running it several times, because lab results vary slightly between runs.
- Field data will update gradually over a 28-day window.
In parallel, it is worth opening the Core Web Vitals report in Search Console. It is based on the same real-user data, groups similar URLs into groups and shows them as good, needs improvement and poor. After a fix you can ask the report to validate it, and the monitoring process takes 28 days.
When to stop and call an expert
- TTFB is high even after you turned on page caching. This is usually a matter of the server, hosting or server-side code. Sometimes the real solution is not another plugin but an upgrade of the hosting itself, which I wrote about in the guide on cloud server hosting.
- You turned on CSS or JavaScript optimization and part of the site broke, for example a menu that will not open, a form that will not submit or an empty slider.
- INP is poor on a site built with many plugins, and you do not know which one is responsible.
- The site is a store, and any change to the product page or the checkout could hurt orders.
In all these cases, take a full backup before changing anything on a live site.
Frequently asked questions
Which tool should I use for a website speed test?
Google’s PageSpeed Insights, because on the same screen it shows both field data from real users and lab data from Lighthouse. For the picture of the whole site over time, use the Core Web Vitals report in Search Console.
Why does my score change every time I test?
The score is based on a single lab run, and network and server conditions vary slightly between runs. So run it several times and look at the trend, not at a single run.
What is the difference between PageSpeed Insights and Search Console?
PageSpeed Insights tests one URL and shows both field data and lab data. Search Console shows only field data, but for the whole site, grouped by sets of similar URLs.
It says there is not enough real-user data. What do I do?
This happens when there are not enough visits. The tool will try to show data for the whole site, and if that is missing too, you work with lab data only. It is enough to find problems and to compare before and after.
Will a score of 100 put me in first place on Google?
No. Google writes that good Core Web Vitals results do not guarantee a place at the top of the results, and that content relevance comes before page experience.
How long does it take to see an improvement after a fix?
In lab data, right after clearing the cache. In field data the change builds up over a rolling 28-day window, because that is the period it covers.
If you ran a website speed test, went through the steps and the metrics are still not moving, or a fix broke something on the site, I can handle it for you.